-Features-
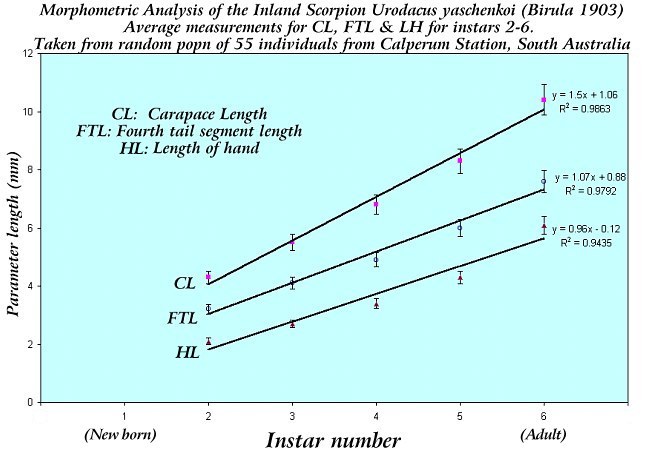
Morphometric Analysis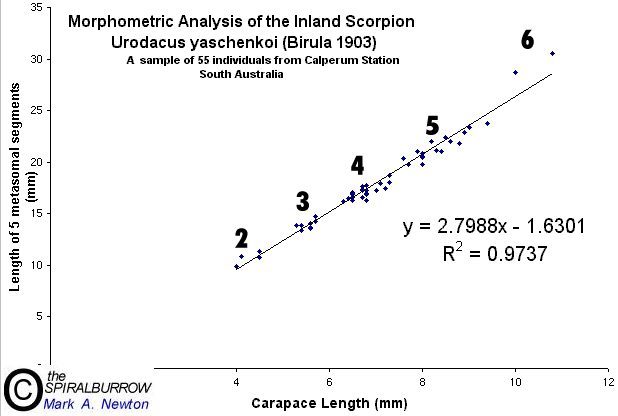
The graph above plots the relationship between carapace length and the total length of the 5 metasomal segments of Urodacus yaschenkoi from South Australia.
55 scorpions were captured out of 70 established pitfalls. The data should not be used to represent age specific population structure as not all scorpions from the individual burrows were studied in this analysis.
The morphometric study was conducted to enable each scorpion to be easily identified as to which instar it belonged.
The number alongside each group of points represents the instar number of that group. The first instar is missing as these remain with the mother in the base of the burrow and hence were not measured. The regression equation is shown with a correlation coefficient of 0.97, which indicates the data fit the regression equation with a high degree of accuracy.
Each group of data points represents an ecdysial or molt phase in the scorpions life history. The data appears as groups because the scorpion increases in size in quantum jumps with each molt rather than gradually. Hence the instar is a qualitative measurement of the scorpions continual growth, representing each ecdysial phase. Read more about scorpion ecdysis (molting).
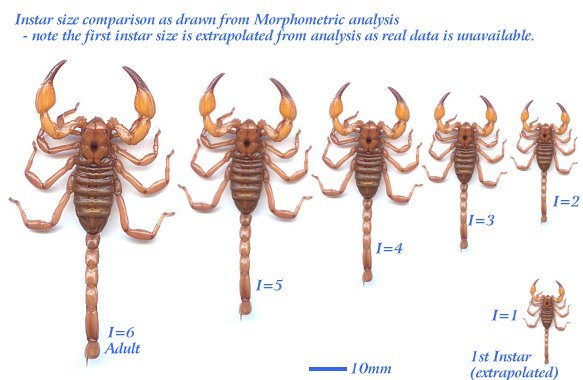
The above diagram shows an adult scorpion reproduced digitally and resized to it's average relative instar. The first instar size is estimated by extrapolating the first instar position on the regression line.
The above graph shows growth from instar 2-6, represented by three measured parameters.
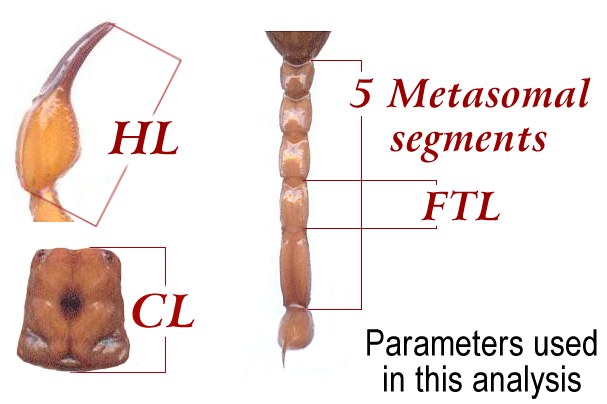
Parameters measured in this analysis
|